
Testing the #1 TradingView Strategy
Does the current #1 ranked strategy on TradingView really work, or is it just hype? - "RSI Monthly Crossover Strategy"


Hey! This is my first article. I want to start with the simple trading idea.
In this article, I’ll guide you through my process of testing a TradingView strategy as it is, evaluating its performance, and then applying some of my tweaks to see if I can improve it.
Strategy Overview
Before jumping into the results, let’s briefly summarize the strategy itself.
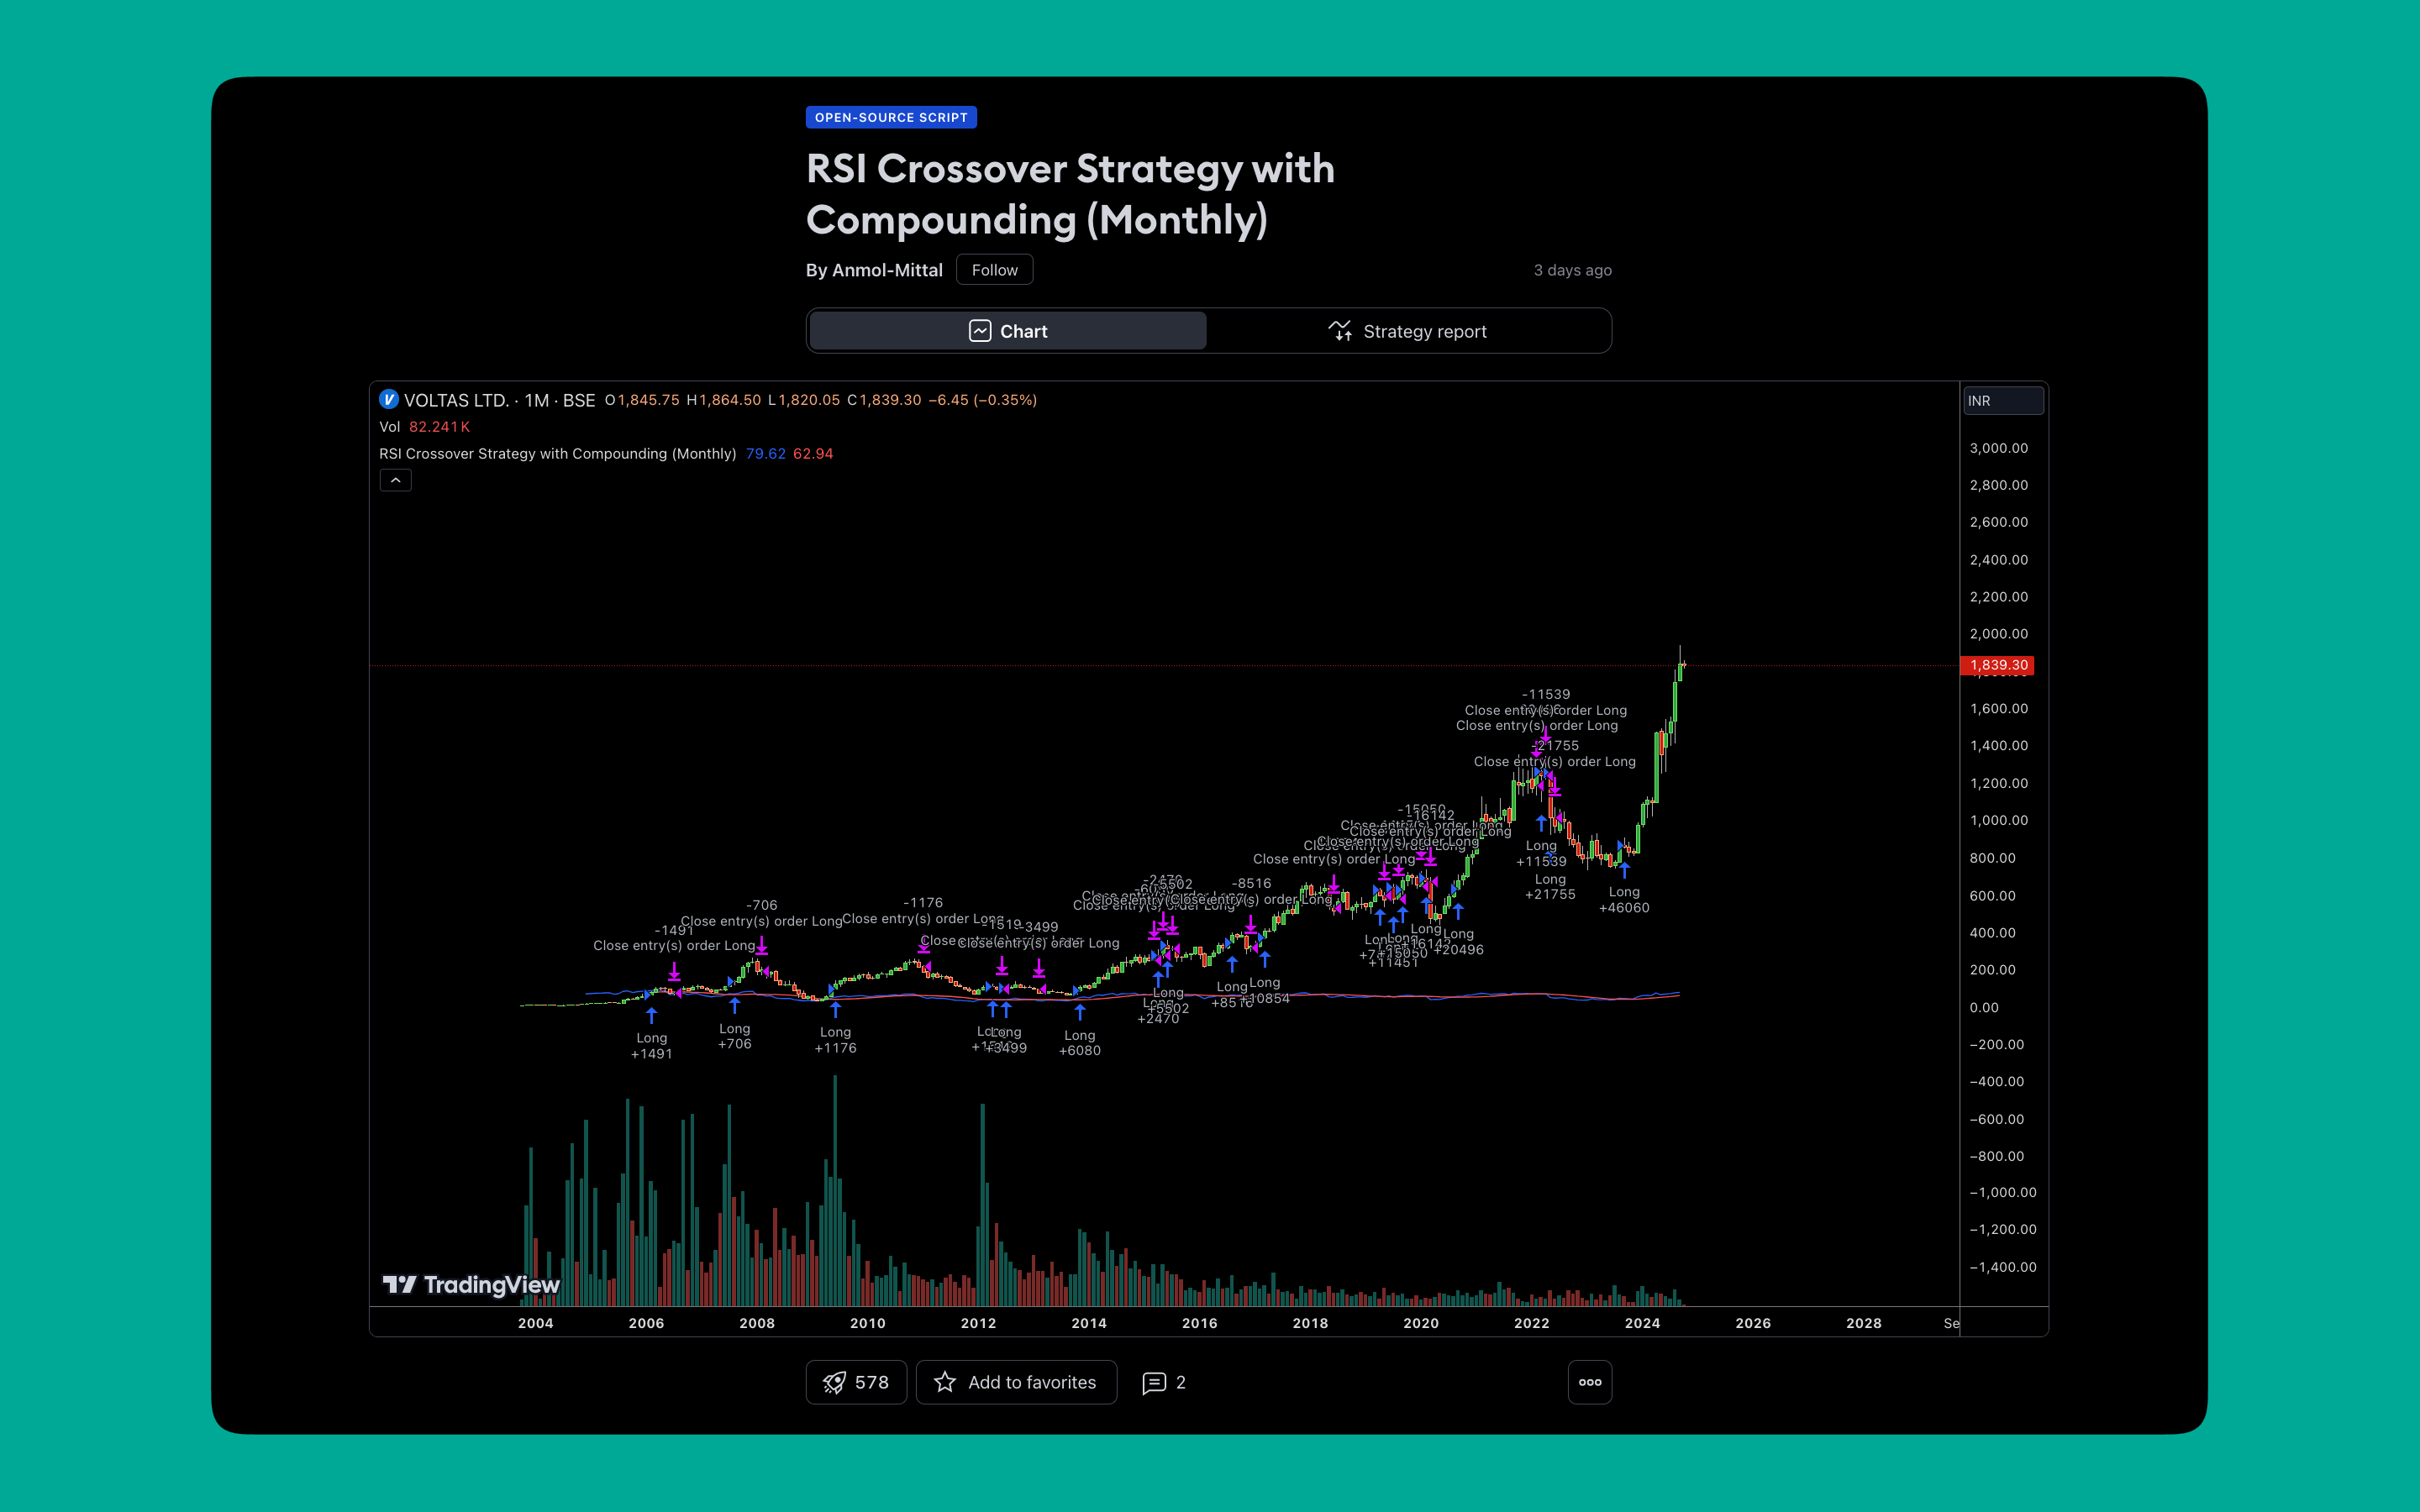
The RSI Monthly Crossover Strategy is built on the Relative Strength Index (RSI) indicator, which is a momentum oscillator that measures the speed and change of price movements. The strategy uses crossovers of the RSI and SMA to signal entries and exits in trades. Additionally, the strategy implements monthly compounding to potentially boost returns over time.
TradingView strategy link is HERE.
Setup
Rules:
Buy – When the monthly RSI(14) crosses above its monthly RSI(14) SMA.
Exit – When the monthly RSI(14) SMA crosses below the monthly RSI(14).
Trading cost:
The default Interactive Brokers (IB) commission was applied.
Settings:
Starting Balance: $100,000
Bar Size: Daily (The strategy operates on monthly data, but using daily bars helps to monitor daily gains and drawdowns.)
Start Date: 01/01/01
Using S&P 500 survivorship-free data. (I am using Norgate Data)
No fees were added to the SPY buy & hold benchmark.
Stocks selection:
A 5-year rate of change (ROC) filter was used to ensure I’m only buying stocks with strong long-term performance, avoiding short-term pumps or themes.
Max Positions: Initially set at 10 (positions), tested with 20 and 30. All results were very similar.
No idea how to code this?
You can download this RealTest code here.
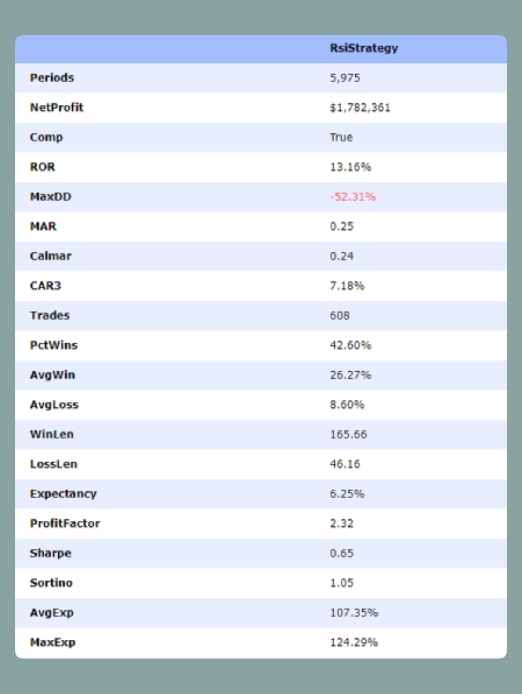
Initial Results:
Visual Chart (logarithmic scale)
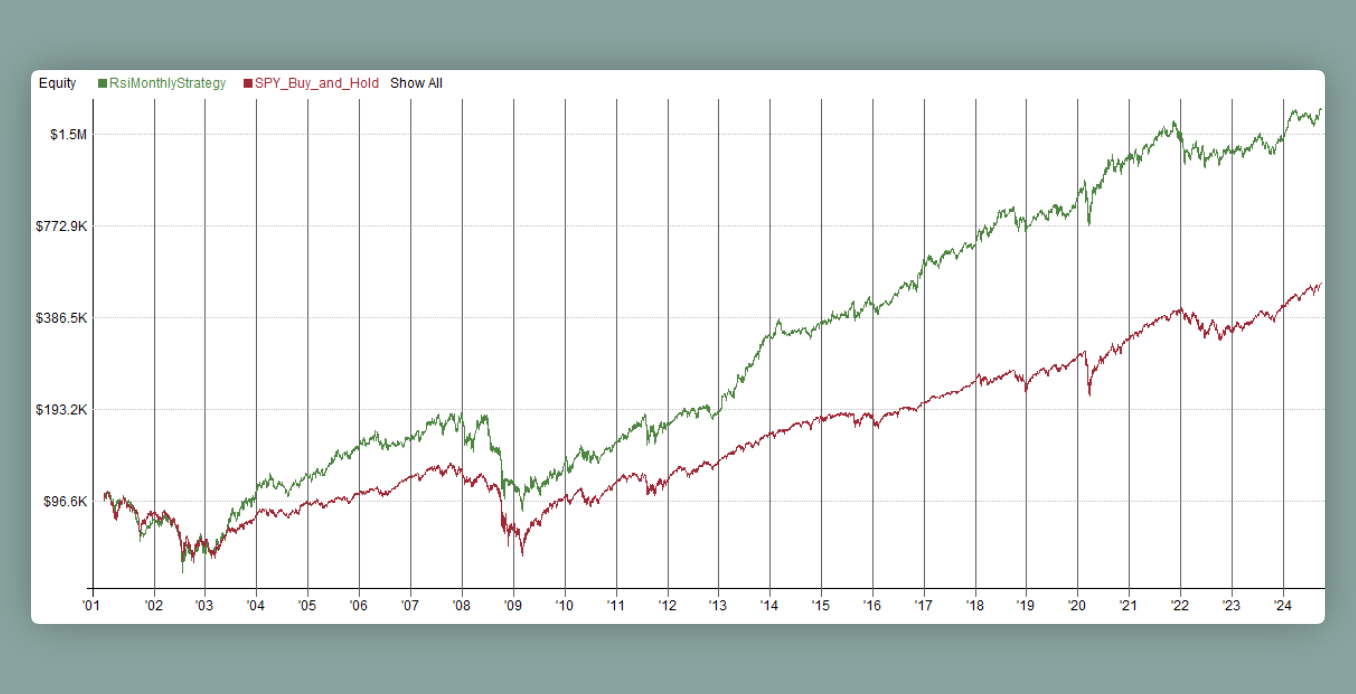
As we can see, the strategy underperforms when the S&P 500 is in a downtrend.
To address this, I’ve implemented a rule where no new trades are taken if the S&P 500 is trending downward.
Additionally, I added a limit entry based on the previous candle’s close. This is because prices can gap up on weekends on a daily timeframe, but on a monthly timeframe, they almost always return to the last month's close.
That’s it, just two robust rules added.
I also included a limit extra: the price must move 0.1% beyond the limit price to get filled. This isn't a strategy rule, but a backtest adjustment to make the results more realistic.
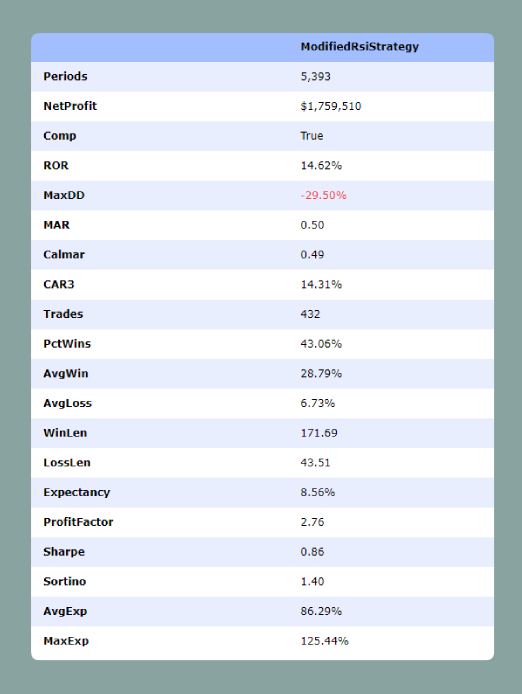
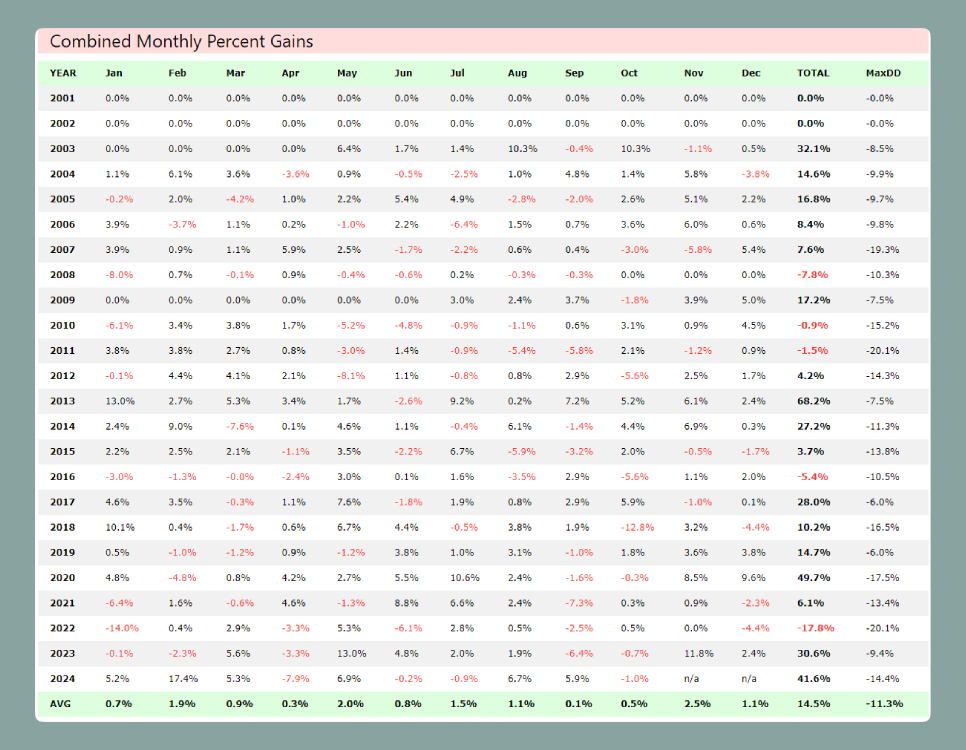
Modified Results:
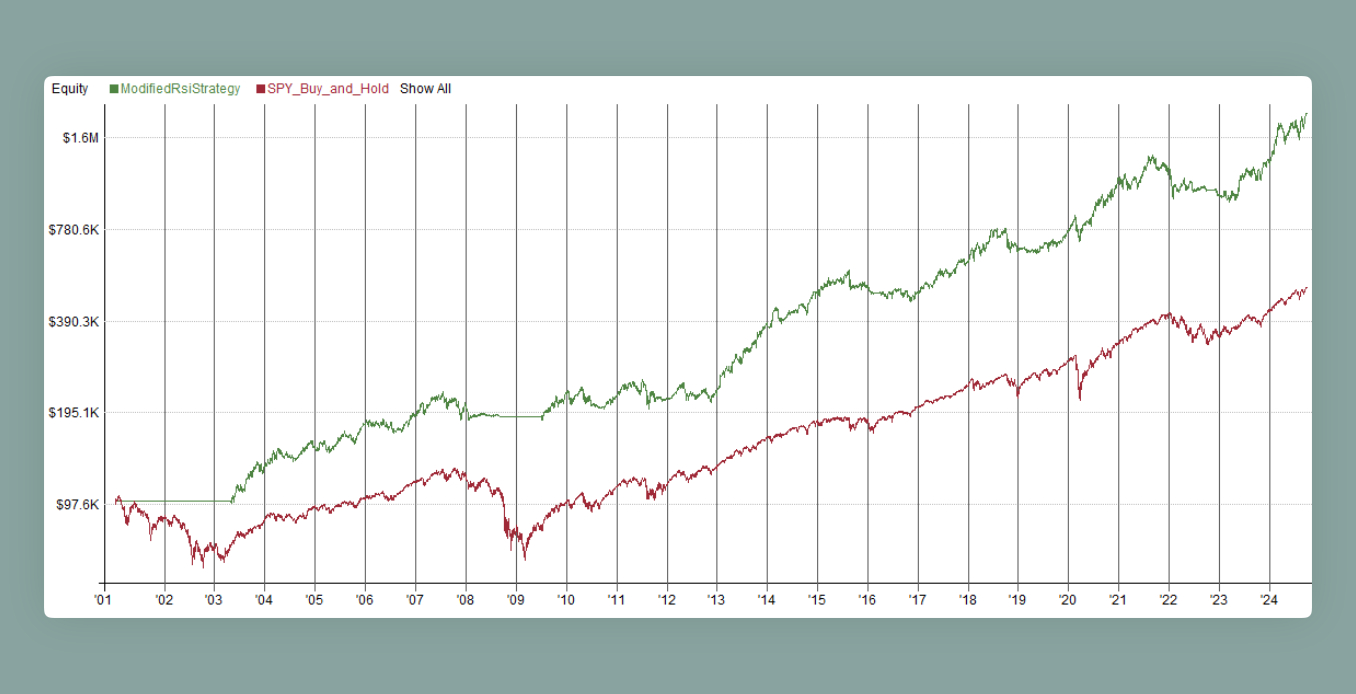
Combined Monthly Percent Gains
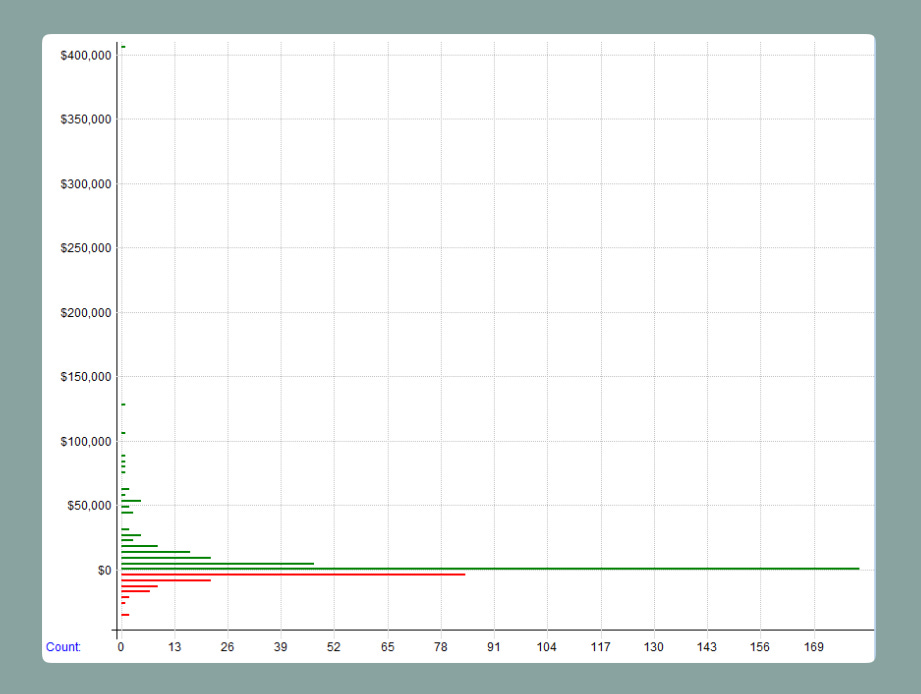
Distribution Of Gains
This strategy holds winning trades and quickly exiting losing ones.
Can we make it better?
Maybe… :)
Scaling in and out seems like the best approach to lock in profits and gradually build a position.
In my next article, I’ll explore and test the most effective and robust scaling strategies for this system. If you have any ideas on scaling in and out that you think could work, please share them in the comments below, I’ll be sure to test them all.